Mapping wildfires with Datasette and Felt
It’s a testament to how bad 2020 was that I barely remember the wildfire season, which was the worst in at least 40 years. Friends in the Bay Area complained about being stuck inside to avoid the horrific air quality, and thousands were evacuated to shelters while the COVID-19 pandemic peaked.
Yet an EPA rule could allow that smoke to be excluded from official pollution records, as my colleagues reported:
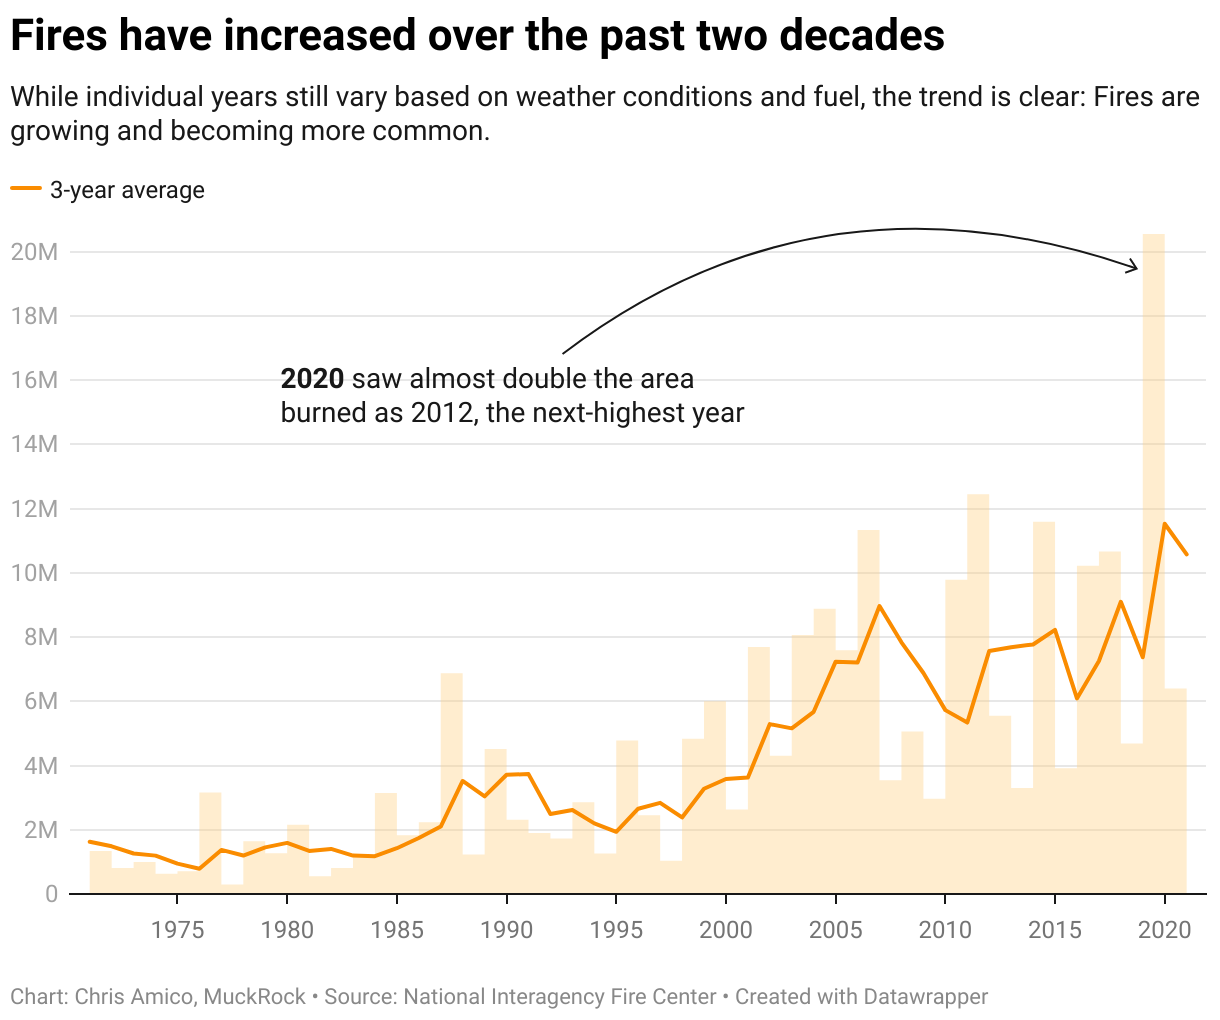
Over the last three decades, the number of acres burned by wildfire has grown, spewing smoke across California and the country. The new GAO report highlights how a loophole in the Clean Air Act permits the EPA to erase pollution — not from the sky, but from the record.
The tool for erasing some of the worst air-pollution days is called the “exceptional events” rule — a legal pathway that allows local regulators to make a case that air pollution from “natural” wildfires shouldn’t count against their federal air quality goals.
As part of that story, I mapped and charted 40 years of wildfires using data from the National Interagency Fire Center.
I recommend looking at the map on the biggest screen you can, and zooming into a place you know. You can filter the map to show one decade at a time, and the change is shocking in some places. Sonoma County is a good place to start.
I used Datasette and my SpatiaLite stack to analyze fire data. The code is available on Github. A few libraries really helped:
- geojson-to-sqlite loads GeoJSON into a SQLite database
- datasette-geojson adds GeoJSON output to Datasette
- datasette-geojson-map renders a map for geographic queries
- datasette-query-files lets me write canned queries as SQL files
I can’t say enough how useful it is to be able to ask a question, write a SQL query and see a map. Once I had a version version I liked, I downloaded the GeoJSON version of the same query and plugged it into Felt and styled an interactive map.
For the chart, I wrote grouped and summed fires by year and added a three-year rolling average. I exported that as a CSV file and plugged it into Datawrapper.
Coding the map and chart by hand probably would’ve taken me a day, and they might not have looked as nice. I also would’ve needed hosting infrastructure, which I haven’t yet set up at MuckRock (and maybe I never will). Instead, I had drafts of each visual in front of editors in less than half an hour.
Update: I had to rebuild the map by hand after Felt started requiring paid plans to embed maps. I’ll write more about how I built this new version in a later post. The original map is still on Felt.